In Circuit Test
<sidebar>Sidebar: Flowcode Help Overview:ChipSpecific</sidebar> ICT functionality is a key feature provided by Matrix's Ghost Technology. It allows monitoring of all the external signals of your target Microcontroller by displaying real time signal data onto the scope. Data busses can then be decoded with the data appearing in a nice formatted way on the console window.
When ICT is enabled or disabled there is no need to re-program the target device. Once ICT is enabled the Flowcode panels are temporarily disabled as they can no longer run their own simulation code.
Contents
ICT Hardware Targets
- Matrix EB006 PIC Multiprogrammer Version 9
- Matrix EB091 dsPIC Programmer
- Matrix Flowkit II ICD tool - Compatible with Arduino and 3rd party hardware.
- More coming soon...
Ghost Settings
Information on setting up and using Ghost is available from the link below.
Information on using the oscilloscope window is available from the link below.
Configuring the data recorder window
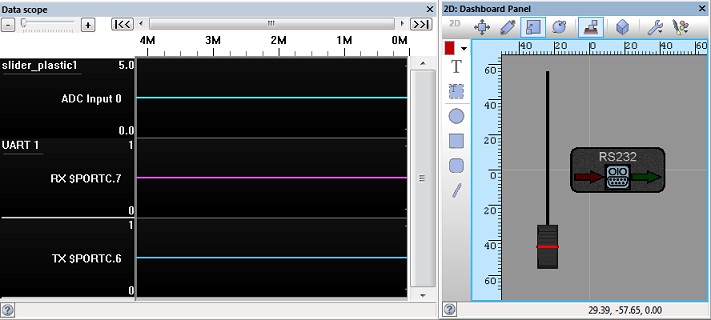
The daat recorder window can be automatically configured by simply adding certain components to the panels. For example an analogue based component will automatically create a analogue scope trace and a communications component will automatically create digital traces (the only requirement is that "Scope Traces" property be set to "Yes" as this defaults to "No"). Other pins can be easily added to the scope by using the ScopeViewer component available from the Component Toolbar -> Tools -> Matrix Tools.
Configuring the scope window
Packet Decoding
Communications buses can be decoded using the ICT feature to work out what values to bus is sending out an receiving.
Supported Busses
- UART (RS232, GSM, GPS, Modbus, Bluetooth, ...)
- SPI (SPI Master, FAT, EEPROM, RTC, ...)
- I2C (I2C Master, Accelerometer, EEPROM, RTC, ...)
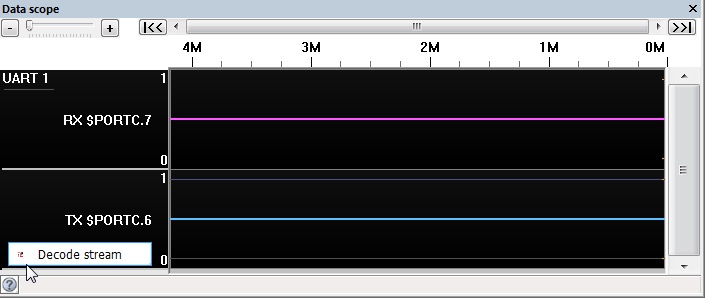
Decoding is done by stopping the ICT operation and clicking the decode stream button which appears when hovering over the right portion of the scope window or by right clicking the scope trace.
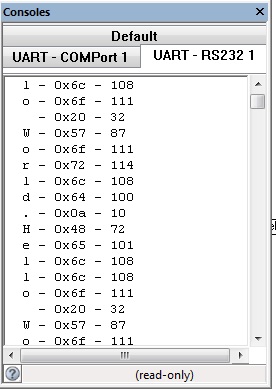
Decoded data then appears on the scope and console windows.


