Difference between revisions of "Simulation Debugger"
From Flowcode Help
Jump to navigationJump to search| Line 1: | Line 1: | ||
<sidebar>Sidebar: Overview of Simulation</sidebar> | <sidebar>Sidebar: Overview of Simulation</sidebar> | ||
| − | |||
| − | |||
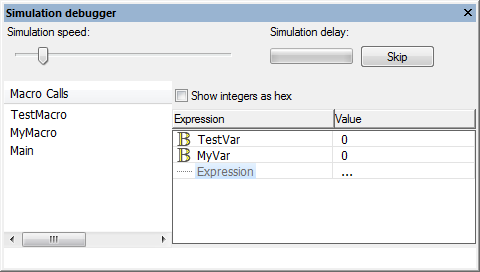
The '''Simulation debugger''' window becomes active during simulation, it is used to monitor the status of the variables in your program and the macros which are being called, this monitors the process of the microcontroller (and simulation) when running the program. | The '''Simulation debugger''' window becomes active during simulation, it is used to monitor the status of the variables in your program and the macros which are being called, this monitors the process of the microcontroller (and simulation) when running the program. | ||
| + | [[File:Gen_Simulation_Debugger_Example.png|center]] | ||
The Simulation debugger also supports the ICD mode allowing for the macro call stack and variable values to be read directly from the microcontroller as it runs, it can also be used to pass or receive values of memory locations and registers on board the target microcontroller. This is useful for detecting and troubleshooting call stack overflows and precisely monitor the program as it runs. | The Simulation debugger also supports the ICD mode allowing for the macro call stack and variable values to be read directly from the microcontroller as it runs, it can also be used to pass or receive values of memory locations and registers on board the target microcontroller. This is useful for detecting and troubleshooting call stack overflows and precisely monitor the program as it runs. | ||
Revision as of 14:16, 12 August 2013
<sidebar>Sidebar: Overview of Simulation</sidebar> The Simulation debugger window becomes active during simulation, it is used to monitor the status of the variables in your program and the macros which are being called, this monitors the process of the microcontroller (and simulation) when running the program.
The Simulation debugger also supports the ICD mode allowing for the macro call stack and variable values to be read directly from the microcontroller as it runs, it can also be used to pass or receive values of memory locations and registers on board the target microcontroller. This is useful for detecting and troubleshooting call stack overflows and precisely monitor the program as it runs.
