In Circuit Test
<sidebar>Sidebar: Flowcode Help Overview:ChipSpecific</sidebar> ICT functionality is a key feature provided by Matrix's Ghost Technology. It allows monitoring of all the external signals of your target Microcontroller by displaying real time signal data onto the scope. Data busses can then be decoded with the data appearing in a nice formatted way on the console window.
When ICT is enabled or disabled there is no need to re-program the target device. Once ICT is enabled the Flowcode panels are temporarily disabled as they can no longer run their own simulation code.
Contents
ICT Hardware Targets
- Matrix EB006 PIC Multiprogrammer Version 9
- More coming soon...
Enabling ICT
The Ghost feature must first be enabled as described here.
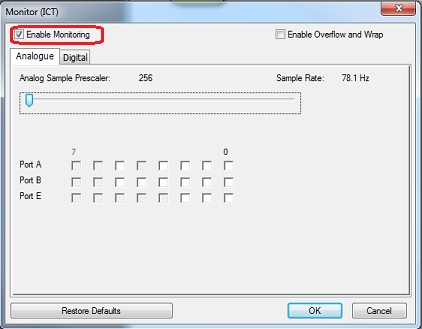
The ICT feature is enabled from the Monitor(ICT) menu reached via "Debug -> Ghost -> Monitor(ICT)".
The Ghost button on the toolbar will indicate that Monitoring is enabled :-
The PLAY button is now set up to start the monitoring process when pressed.
Configuring ICT
Once enabled you can configure the ICT Options from the Monitor(ICT) menu reached via "Debug -> Ghost -> Monitor(ICT)".
General Options
Enable Monitoring
Specifies if the ICT feature is switched on or off.
Enable Overflow and Wrap
Specifies what the ICT functionality should do if it runs out of memory.
- Unticked - ICT operation will pull through all the collected data and then end which will end the simulation.
- Ticked - ICT operation will wipe the internal data and then resume ICT operation which will likely cause a glitch in the data but allow the ICT operation to continue.
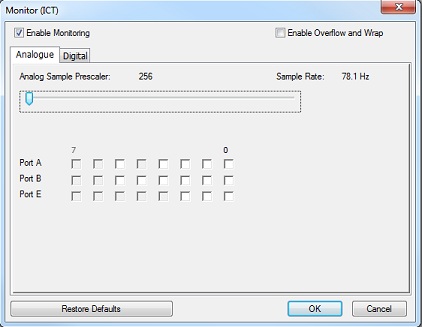
Analogue Tab
Analogue Sample Prescaler
The Analogue Sample Prescaler slider control adjust the prescaler value between 2 and 256, which produces an analogue sample rate based on dividing the digital sample rate by the prescaler.
Analogue Port Selection
Specifies the analogue pins we will sample during ICT operation. The analogue samples are interlaced into the digital samples so it is good practice to only enable the analogue channels which you specifically need to monitor.
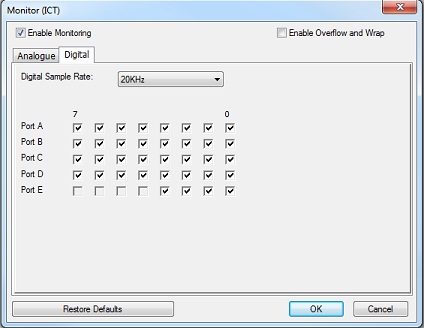
Digital Tab
Digital Sample Rate
Specifies the digital sample rate used by the ICT functionality. This sets the rate at which we sample all digital signals. Only signals that have changed state since the last sample (and selected by the user) will be sent through the USB meaning the more that is going on the more data is required to keep track of the activity.
Digital Port Selection
All digital port pins are enabled (ticked) for sampling by default, but they can be unticked in order to mask off certain high frequency ports such as PWMs. This allows the user to see more meaningful data on the ports he is interested in.
Configuring the scope window
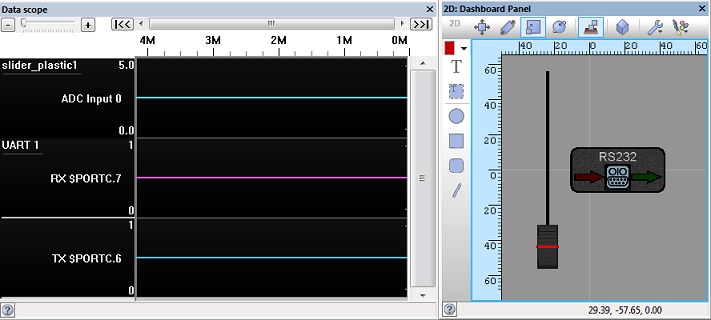
The scope window can be automatically configured by simply adding certain components to the panels. For example an analogue based component will automatically create a analogue scope trace and a communications component will automatically create digital traces (the only requirement is that "Scope Traces" property be set to "Yes" as this defaults to "No"). Other pins can be easily added to the scope by using the ScopeViewer component.
Packet Decoding
Communications buses can be decoded using the ICT feature to work out what values to bus is sending out an receiving.
Supported Busses
- UART (RS232, GSM, GPS, Modbus, Bluetooth, ...)
- SPI (SPI Master, FAT, EEPROM, RTC, ...)
- I2C (I2C Master, Accelerometer, EEPROM, RTC, ...)
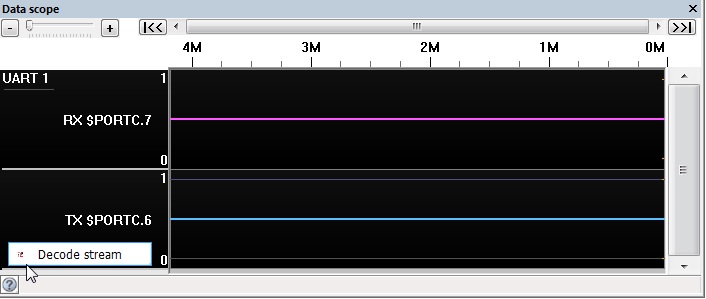
Decoding is done by stopping the ICT operation and clicking the decode stream button which appears when hovering over the right portion of the scope window or by right clicking the scope trace.
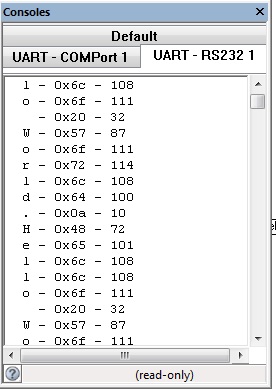
Decoded data then appears on the scope and console windows.
