Difference between revisions of "Using the Data Console"
| Line 1: | Line 1: | ||
<sidebar>Sidebar: Advanced Features</sidebar> | <sidebar>Sidebar: Advanced Features</sidebar> | ||
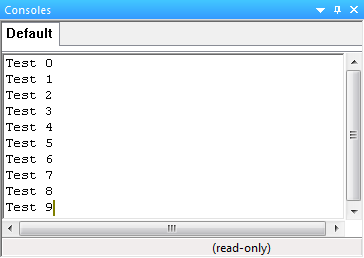
[[File:Gen_Data_Console_Example_Test_01.png|right]] | [[File:Gen_Data_Console_Example_Test_01.png|right]] | ||
| − | The '''Data Console''' allows the user to | + | The '''Data Console''' allows the user to monitor raw data and display the process of a component fucnction and even the progress of the flowchart by writing to the console using [[Simulation Macro Icon Properties|Simulation Macros]] to send / write data to the console. |
| − | The console has many macros and functions | + | The console has many macros and functions for effective use in simulation, text and data can be displayed on the console from raw data to variable values and even manually inputted text strings. |
| + | |||
| + | Text can be inputted before or after data from variables or other sources, for example, you can write text to the console before a variable value to name or label the data, you can also write text after the variable to display a value or unit after the data e.g. ''Volume ='' '''10'''''dB'', ''Speed ='' '''25'''''mph'' etc. (''text before'' '''variable value''' ''text after'') this can be done using only 3 Simulation Macro icons. | ||
Revision as of 09:55, 16 August 2013
<sidebar>Sidebar: Advanced Features</sidebar>
The Data Console allows the user to monitor raw data and display the process of a component fucnction and even the progress of the flowchart by writing to the console using Simulation Macros to send / write data to the console.
The console has many macros and functions for effective use in simulation, text and data can be displayed on the console from raw data to variable values and even manually inputted text strings.
Text can be inputted before or after data from variables or other sources, for example, you can write text to the console before a variable value to name or label the data, you can also write text after the variable to display a value or unit after the data e.g. Volume = 10dB, Speed = 25mph etc. (text before variable value text after) this can be done using only 3 Simulation Macro icons.
The Data Console can be used for creating counters, trackers and monitoring information etc. this information is displayed in the console to present relevant information and data to clarify the process of the program and is especially useful for demonstrating the program.
The output and input text colour can be changed using the SetOutputRGB and SetInputRGB simulation functions, to do so you must enter the required parameters; a Handle value for the ConsoleHandle parameter and a ULONG value for the RGB parameter. This can be changed multiple times so specific text and data can be a different colour to highlight important or relevant information.
